Help smartphone users self-track(almost) every area of their life, and through quantified self promote healthy mind & physical living. No wearable tech required. (Concept, UX, UI, Motion design, Generative art, Mobile)
Brief:
Mind-Fit is a digital application that helps Smartphone users synchronize/harvest data across different apps and aims to help self-track (almost) every area of your life without any wearables and identify and flag early signs of increasing stress, anxiety, depression, etc., also provide insight into what’s driving those changes promoting a healthy mind & body.
Mind-Fit uses various apps and IoT that collect data. We believe a lot of value lies in connecting these apps and their data to help users self-track (quantified self).

Key Features:
Mind-Fit analyses data that the user is actively generating through their use of a smartphone, physical activities. Application monitors the behavioral shifts through the proximity with other human beings and interaction between them.
Mind-Fit functions on the minimal data inputs from the user and without a tracking device.
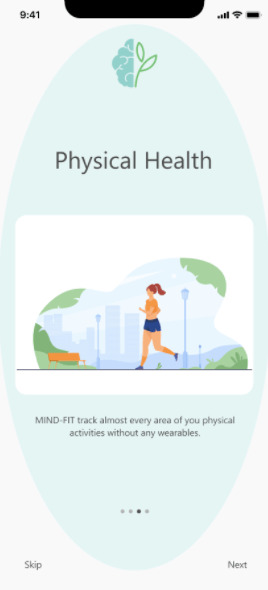
The following pages detail the key features of the applications, and they may benefit the user to regain mental and physical wellness.

HOME
Mind-Fit assigns a generative art (waveform) to the user, after analyzing the data received through smartphone usage and physical activity, proximity with other human beings, and interactions with them.
State of Mind & Body: Mind-Fit generated a mood board as per the user’s activity and behavior. The board gives the user a chance to compare today’s mood with a previous mood board. Facilitating the analyze mood dependency over situations, offering him/her better control.
Statistics: from mind and body give a quick look at the screen time, step count, tone of speech & heart rate.
Personalized suggestions: Monitoring and analyzing the wave pattern Mind-Fit suggests personalized content which may be helpful in coping up with the situations. These suggestions include learning techniques (For example; Ways to meditate), podcasts, inspirational videos, etc.

Mind
Reflection of your digital-activity impact on your Mind. MindFit analyses your screen time, web search, tone of speech, music, friends proximity, and other online activities and It categorizes your mind into 3 states, Calm, Neutral and Hyper. and provides personalized evidence-based information.
Screentime: Provides real-time reports showing how much time you spend on your phone and it helps you manages how you spend time on which app, website and what information you consume etc.
Web search: Looks into what content you access on World Wide Web and its impact on your mind
The tone of speech: picks up on the pitch, intensity, tempo of your voice and then categorizes them into notable moments that you can go back and review throughout the day.
The music displays what genres of music you listened to and what time of the day and shows its impact on your mind Friends proximity displays what genres of music you listened to and what time of the day and shows its impact on your mind

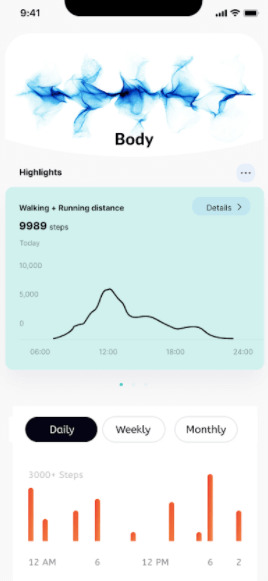
Body
Tracking physical activities: MindFit tracks the user’s physical activities during the entire day and gives feedback on the basis of their daily activities. The user is given information about the history of their activities and a comparison between their past and present physical activities.
Different physical activities tracked: Calories intake, Steps, Last night’s sleep, Heart rate Calories burned

Community
Mind fit has made some of the predefined community groups where users can communicate in rooms that accommodate groups of thousands of people. The user can easily access the group and talk about their mental health or the other problems which they are suffering. This will help the user to find better solutions to their problems which they are not able to express socially.

Data mirror – Generative art
The Waves will harvest the data from the user’s daily activities of both mind and body section. The synchronised date from different sections will help the waves to move from left to right. The movement of waves are divided into 3 categories gloomy, neutral, and cheerful. If the user activities are very less in amount the waves will move very slowly, which means the user is not spending the required amount of time, and the bar graph will goes down to Gloomy. The higher the activities the faster the waves will move from gloomy to cheerful. The average amount of activities is supposed to be on neutral bar.


Why now?
An increase in mental health problems is an all-time high.
1 in 5 U.S. adults experiences mental illness. 2017 study estimates that 792 million people lived with a mental health disorder. This is slightly more than one in ten people globally. Early signs of mental illness such as anxiety, depression, and loneliness can be preventable if diagnosed early.

SmartPhone and Self-tracking
Off-the-shelf smartphones already come equipped with the sensors needed to obtain a great deal of information about their owners’ behavioral lifestyles.
Some of the most common sensors found in smartphones include the accelerometer, Bluetooth, GPS, light sensor, microphone, proximity sensor, and WiFi.

The problem
1) There are countless self-tracking apps that require the user to wear a wearable or need active participation to track themselves.
2) There are currently hundreds of mental health apps, but it is estimated that only about 3% to 4% are actually evidence-based.
3) No platforms available to track all the activities that the user is performing on his/her smartphone
4) Most self-tracking apps need active participation for better results

Solution
Most of us use various apps and IoT that collect various data. Yet a lot of value lies in connecting these apps and their data to help users self-track(quantified self) and build a evidence-based comprehensive Body and Mind app

Design Process
DISCOVER:
1) MARKET STUDY
2) USER INTERVIEWS
3) EMPATHY MAPPING
4) COMPETITOR ANALYSIS
DEFINE:
1) USER PERSONA
2) TASK FLOW
3) WIREFRAME
DEVELOP:
1) BRAINSTORMING
2) USER INTERFACE & EXPERIENCE
3)MOTION DESIGN
DELIVER:
1) INTERACTIVE PROTOTYPE
2) UI/VISUAL DESIGN
3) UX WRITING
Whom are we talking about?


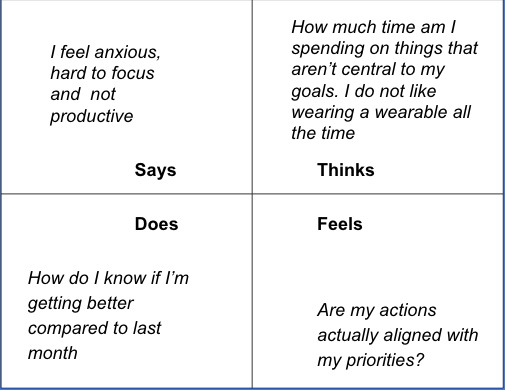
Empathy Mapping

Product
DIRECTION:
Data monitoring and analysis are achieved with the use of the most common device in human usage. The user must be an authentic member of the Mind-Fit (anonymous) with permission access.
COLLECTION:
Mind-Fit access data through the user’s behavior of using a smart phone such as search history, sleep cycles, tonality of speech etc.
INTERFACE:
Mind-Fit represents the mind and physical health in the form of generative art (waves). Detailed tracking elements can be monitors individually. App also suggests the overcoming measures to the user.
OUTCOME:
User can access evidenced based personalised information regarding mental and physical health analysis on a single platform.
Operations
•Walk 10,000 steps: Google Fit, via Xiaomi Mi Band 3
• Social networks: WhatsApp, Instagram, Facebook, Twitter, Snapchat, etc.
•Sleep 8 hours: Google Fit, via Xiaomi Mi Band 3
•Exercise for 30 minutes: Google Fit, via Strava or Strong app
•Learn German: Activity Watch, via Duolingo app
•Inbox zero: Gmail APIs
•Brush teeth: Nomie
•Take medication: Nomie
•Plug-in phone before sleep: Home Assistant, via Home Assistant app for Android

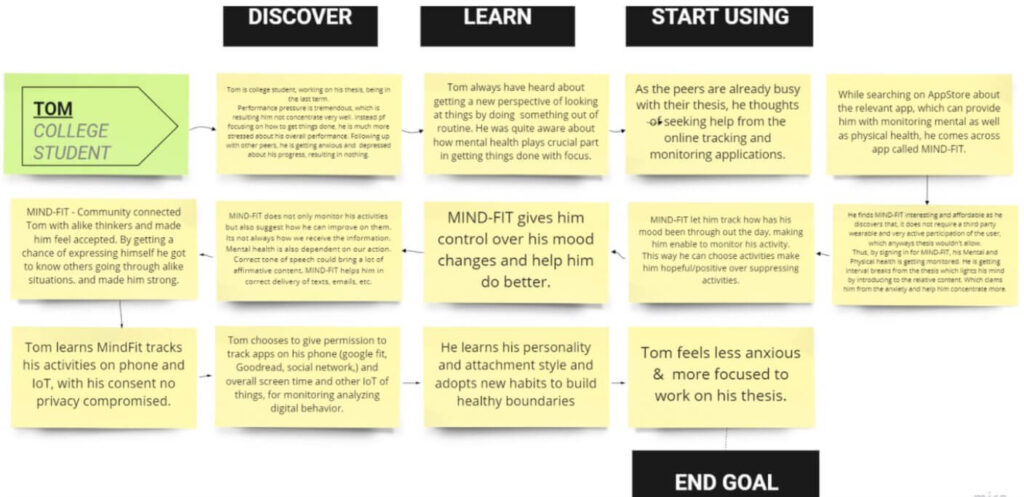
Userstory

Pen-paper and Wireframes
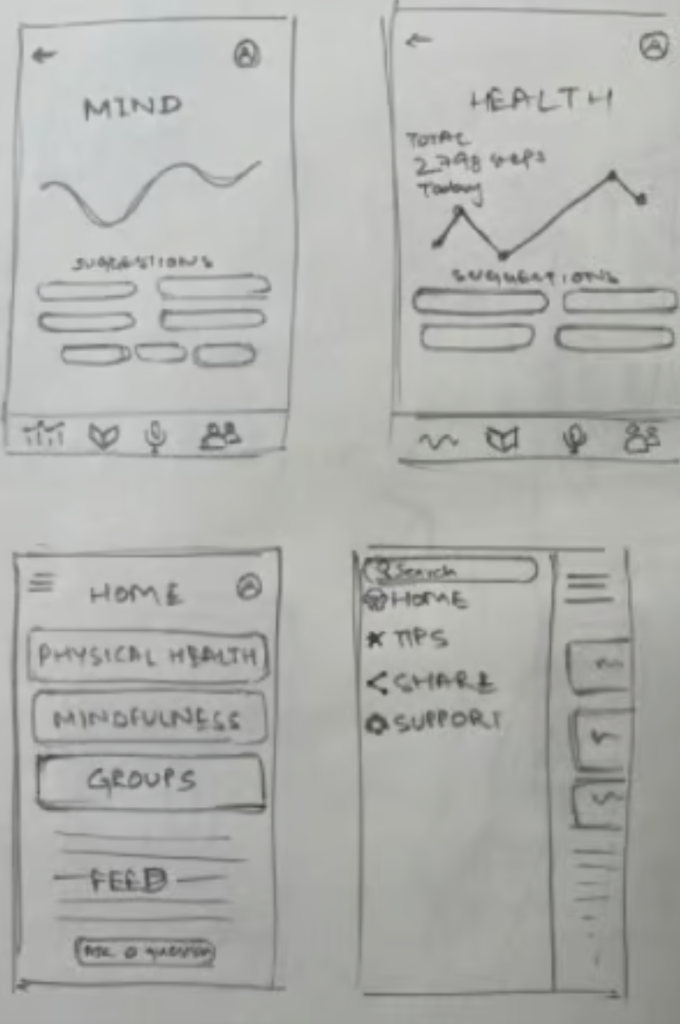


Wireframes


key takeaways
It’s human to want to get better at what we do, not just at work but in life.
How do I know if I’m getting better compared to last month?
What’s impacting my mental and physical health
How much time am I spending on things that aren’t central to my goals? Are my actions actually aligned with my priorities?